When we factor in all available studies and surveys, an average of 1.8 million crimes are stopped by guns.
The Second Amendment limits the government’s power over the people’s right to keep and bear arms for the defense of our nation. However, Americans uniquely have the right to defend our lives with the most effective tools available.
A widely disputed topic between gun advocates and anti-Second Amendment advocates is the number of defensive gun uses (DGUs) each year. Fortunately, we have data to better understand the effect armed civilians have on criminality.
The following section covers everything we know about defensive gun use in the U.S.
Report Highlights:
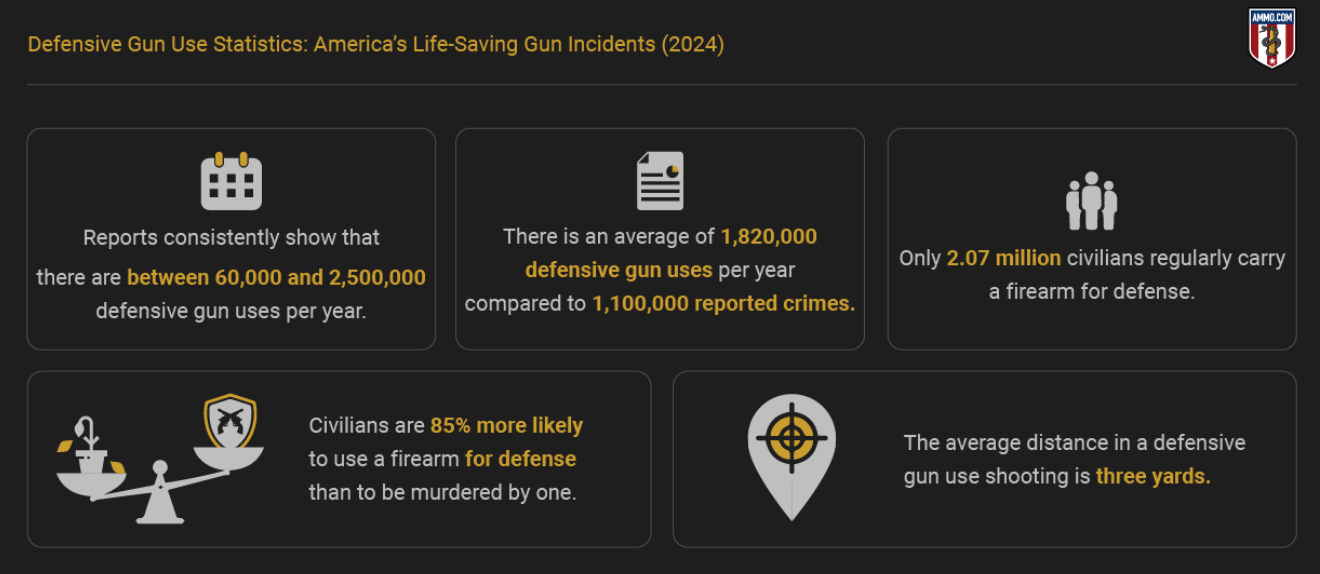
- Reports consistently show that there are between 60,000 and 2,500,000 defensive gun uses per year.
- There are an average of 1,820,000 defensive gun uses per year compared to 1,100,000 reported crimes.
- Only 2.07 million civilians regularly carry a firearm for defense.
- Civilians are 85% more likely to use a firearm for defense than to be murdered by one.
- The average distance in a defensive gun use shooting is three yards.
How Often Are Guns Used in Self-Defense?
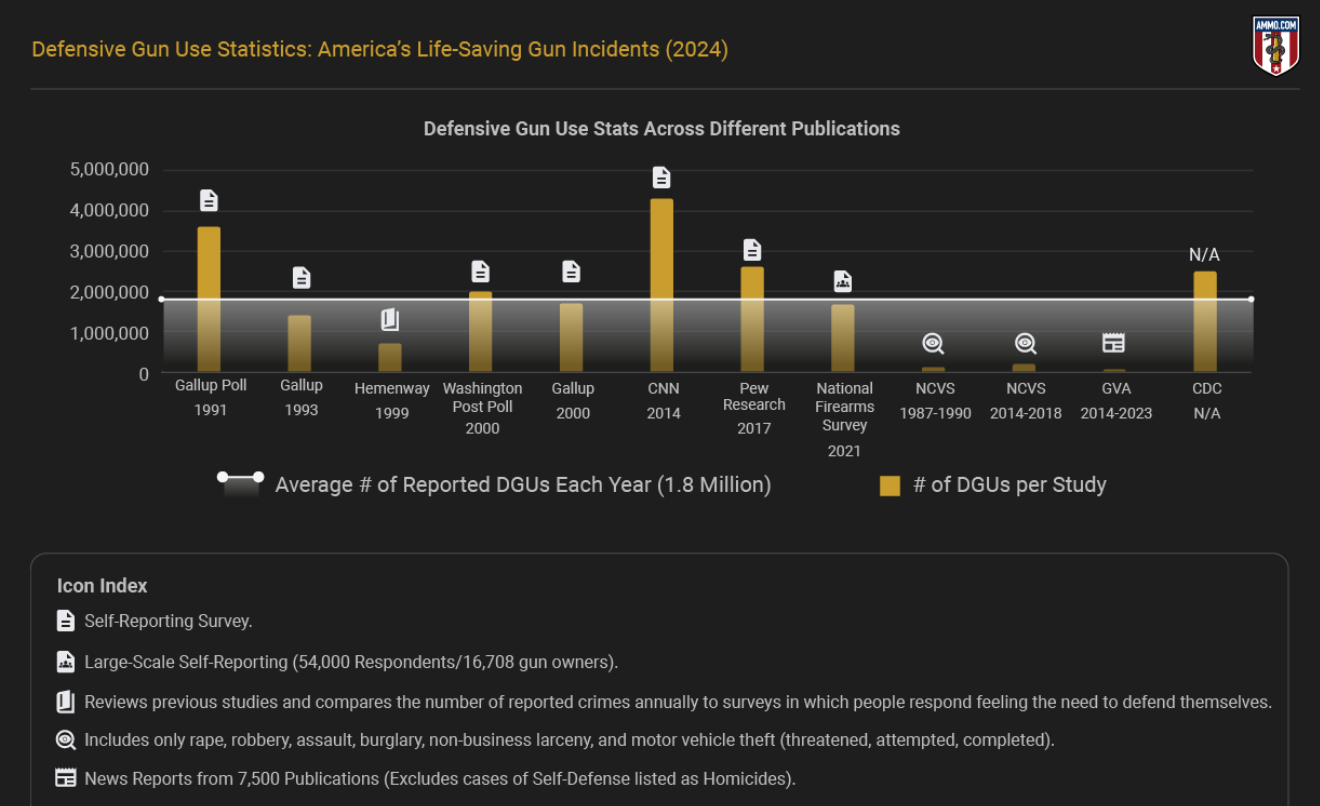
The number of defensive gun uses (DGUs) is hotly contested and widely debated because the definitions and data collection methods vary. However, studies consistently show between 60,000 and 2,500,000 DGU uses per year. The average yearly reported number of self-defense cases between 1990 and 2023 is 1,820,000 annually. 7
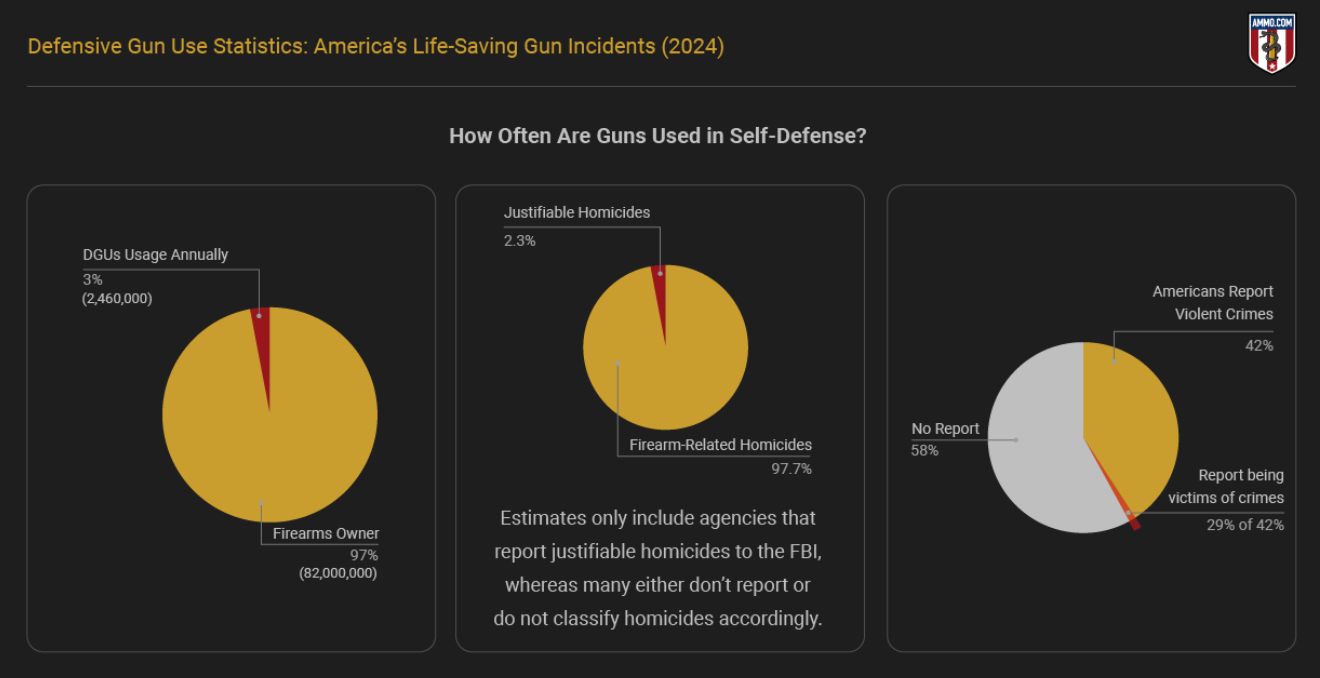
Defensive gun uses are often debated because the information comes from survey data, and many wonder how 2.3 million DGUs are even possible annually.
Some DGU surveys are more broad, asking questions like “Have you ever retrieved a firearm because you perceived a threat?” Others ask more specific questions, such as, “Have you ever retrieved a firearm because you saw an active threat or home intruder?”
Assuming that even the highest DGU estimates are accurate (4.3M uses per a CNN survey), that would only be 2% of all American gun owners thwarting a threat with a gun.
States’ Self-Defense Laws, Permitless Carry, and DGUs
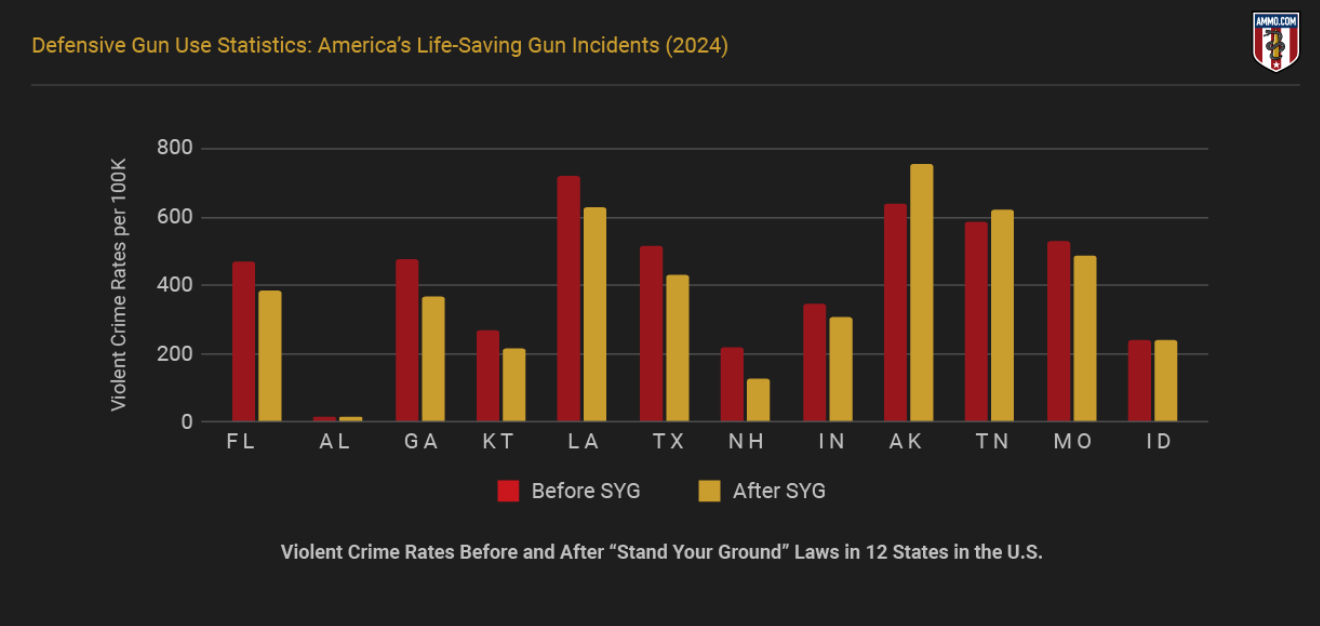
Indiana passed Stand Your Ground laws in 2006 and permitless carry legislation in 2022. In January of 2024, 14 of 18 homicide investigations involved self-defense. From a domestic violence incident to a home break-in, over three-fourths of all deaths in Indianapolis that month involved some type of self-defense claim. 1
Despite a 2022 study 2 stating that Stand Your Ground legislation leads to more homicides, a five-year average of homicides by state does not support this hypothesis. In fact, national homicide rates increased between 2020 and 2022. Furthermore, states with permitless carry legislation and SYG legislation have the same homicide rate average as those who don’t. 3
Unfortunately, the CDC Wonder does not differentiate between self-defense shootings and homicides. However, the evidence is clear: States with strong self-defense laws do not have higher homicide rates than those restricting the right of civilians to defend themselves.
States’ Violent Crime Rates and No Duty to Retreat (Stand Your Ground Laws)
A 2021 study shows that states embracing civilians’ rights to self-defense had little to no impact on violent crime rates. 4 However, 75% of states that passed SYG (Stand Your Ground) laws with no duty to retreat experienced a decline in violent crime victimizations in the following years. 2
The Self-Defense Statistics Debate Explained
Researchers and data analysts have long disputed which defensive use surveys are accurate.
Although the CDC did release a comprehensive study citing 60,000-2,500,000 defensive use cases each year, the government agency quickly withdrew its findings. Self-defense is subjective and, therefore, challenging to identify. Thus, we must understand the debate before accurately assessing how many defensive gun uses are possible.
Variations in Reporting
Although we can’t say exactly how many DGUs occur each year, we can deduce whether they are common or not based on the information that we do have. Various surveys from the early 1990s to 2023 gave us the 60,000-2,500,000 use case estimate.
Defensive gun use has no singular definition. Some researchers refer to the individual’s feelings about the situation. Others assess only those actively involved in violent crimes. Therefore, it’s crucial to get a full view of DGU reports.
The Gun Violence Archives pulls information from 7,000 news publications. Only newspaper articles in which a person used a firearm defensively are included in the 3,165 DGUs between 2014 and 2023. This excludes incidents where a shot is never fired (a firearm is a deterrent) and those where the defender is charged with a crime related to the incident. 6
On the other hand, the National Crime Victimization Survey asked respondents if they’ve ever used a gun defensively regarding non-fatal firearm incidents. This study revealed that 87,000 DGUs occur annually.
Finally, self-reporting surveys, including various DGU situations, have more than one million incidents yearly.
Concealed Carry and Defensive Use Statistics
On average, guns are used in 1,800,000 self-defense incidents annually. Comparatively, between 1.1 and 1.2 million crimes are reported annually. Therefore, defensive gun use is more common than crime.
Although some question the validity of so many DGUs, it is entirely plausible and actually maybe even higher.
Reportedly, 56% of gun owners carry firearms for self-defense purposes. However, only 35% (or just over thirty-five million people) carry their firearms outside the home regularly. Furthermore, 26.5% of those who carry firearms conceal carry. Unfortunately, an additional 35% reported that they had refrained from carrying due to concealed carry restrictions. 9
- 56% of gun owners carry firearms for self-defense, but only 35% have them with some frequency.
- 26.3% of gun owners concealed carry (approximately 2.07 million), while 34.9% have refrained from carrying due to concealed carry restrictions.
- There are between 1.1 and 1.2 million reported crimes yearly, with 1.8 million defensive gun uses annually.
How Many Crimes Are Stopped by Guns
When we factor in all available studies and surveys, an average of 1.8 million crimes are stopped by guns. However, even at a minimum, there are 60,000 crimes stopped by an armed defender each year.
- Of the 1,678 households with firearms surveyed in 1994, 34% of homeowners claimed to have reached for a gun to defend their life or property from a threat.
- 1,896,842 individuals reached for a firearm due to a perceived threat during that same time.
- 503,481 of those homeowners saw an intruder, and 497,646 of those scared an intruder away with a firearm.
- Between 1987 and 1990, there were at least 258,460 violent crimes stopped by armed defenders.

Self-Defense Murders Statistics
On the low end, guns are used in self-defense in 2.3% of all homicides. However, this includes only data compiled by the FBI, with several agencies failing to report justifiable homicide data. Furthermore, civilians use firearms to save lives more often than police officers. 11)
People are 85% more likely to use a gun in self-defense than to be murdered by one. According to the 2016 NCVS survey, guns were used defensively in 166,000 nonfatal violent crime victimizations and 183,000 in property crime victimizations between 2014-2018. In those same years, there were an average of 13,380 firearm-related homicides. 12
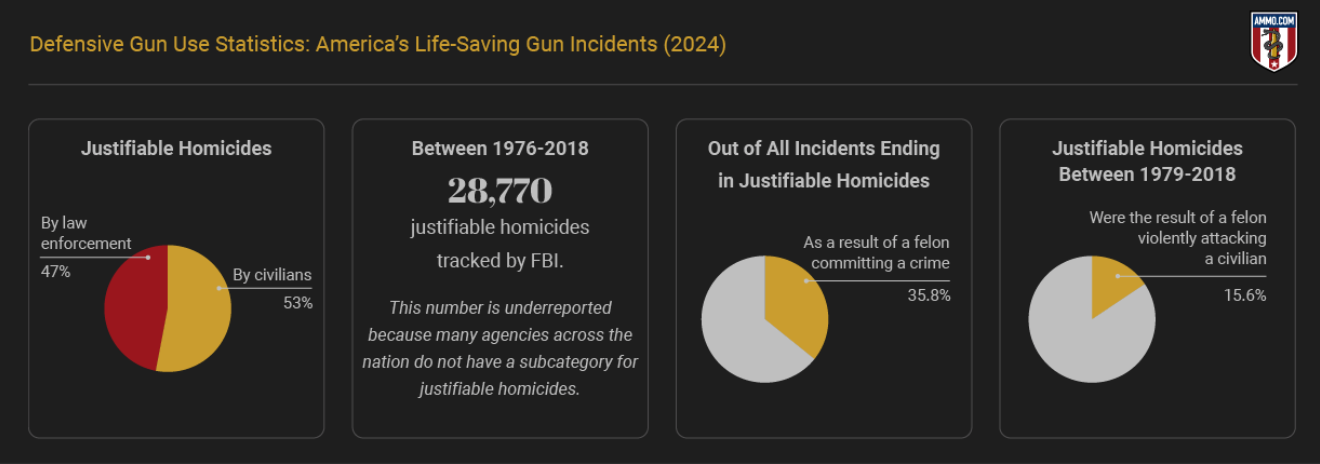
- Civilians committed 53% of justifiable homicides. Law enforcement officers committed the remaining 47%.
- Between 1976 and 2018, the FBI tracked 28,770 justifiable homicides. Disclaimer: This number is underreported because many agencies across the nation do not have a subcategory for justifiable homicides.
- 35.8% of incidents ending in a justifiable homicide are the result of a felon committing a crime.
- 15.63% of justifiable homicides tracked between 1979 and 2018 were the result of a felon violently attacking a civilian.
Odds of Being Shot by a Stranger
Between 2014 and 2018, there were approximately 1,907,300 nonfatal violent crime victimizations in the US. Out of these, 59% (about 1,138,500) were committed by strangers, while the remaining 41% were committed by individuals who were known to the victim, such as acquaintances, friends, or relatives. 17
In 2019, there were 13,927 homicide victims. Among these, 1,372 were killed by strangers, and 6,808 were killed by individuals with no known relationship to them. Additionally, 85 victims were murdered by their husbands, and 28 were murdered by their wives. 18
When Defensive Gun Use Doesn’t Work
Although the research is limited, a 2009 study in Philadelphia does shed light on instances where gunshot victims failed to thwart an attacker.
The study focused solely on gunshot victims who were over 21 and in possession of a firearm at the time of the assault. The control group were individuals of similar age and gender in Philadelphia at the same time of the shooting.
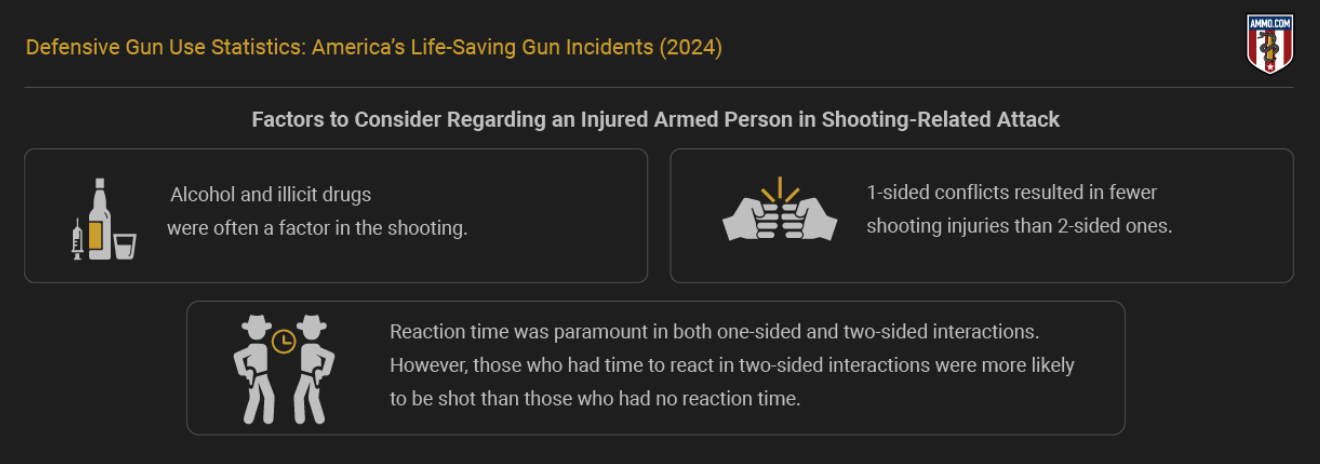
Here are factors to consider regarding incidents where an armed person was injured in a shooting-related attack:
- Alcohol and illicit drugs were often a factor in the shooting.
- 1-sided conflicts resulted in fewer shootings than 2-sided ones.
- Reaction time was paramount in both one-sided and two-sided interactions. However, those who had time to react in two-sided interactions were more likely to be shot than those who had no reaction time.
Ultimately, the gunshot victims in this study were 5.45 times more likely to get shot if they possessed a firearm. However, there were extenuating circumstances such as alcohol, drugs, and even poverty that affected the outcome of this study.
What is the Distance of Most Defensive Shootings
According to the FBI, the average distance of a defensive shooting is 3 yards (9 feet). 5
Average Number of Shots Fired in Defense
According to the FBI, the average number of shots fired in self-defense is only three. 5
Defensive Gun Use in the U.S. Wrap-Up
Although many dispute the plausibility of more than one million DGUs yearly, it is entirely plausible. With millions of gun owners in the U.S. and millions of unreported crimes, more civilians likely stop threats than are harmed by them.
Furthermore, states with permitless carry and stand-your-ground laws experience reduced violent crime rates. Therefore, armed civilians are, at least, not a danger to society.
Sources:
- Indianapolis Police See Rise in Self-Defense Shootings
- Analysis of ‘Stand Your Ground’ Self-defense Laws and Statewide Rates of Homicides and Firearm Homicides
- CDC Wonder Underlying Cause of Death 2018-2019
- Effects of Laws Expanding Civilian Rights to Use Deadly Force in Self-Defense on Violence and Crime: A Systematic Review
- Distance & Shots Fired
- Defensive Gun Uses
- Gun Threats & Self-Defense Gun Use
- Number of US Households
- Gun Ownership by Year
- FBI Defensive Gun Uses by Year
- FBI Justifiable Homicide Civilian/LEO
- Nonfatal Victimizations NCVS
- How Americans Protect Themselves From Crime – Gallup
- Firearms & Home Defense
- Violent Crime Reporting Stats
- Variations in FBI Reporting
- Bureau of Justice Statistics
- Office of Justice Programs
LegalReader thanks our friends at Ammo.com for permission to republish this article. The original is found here.

Join the conversation!