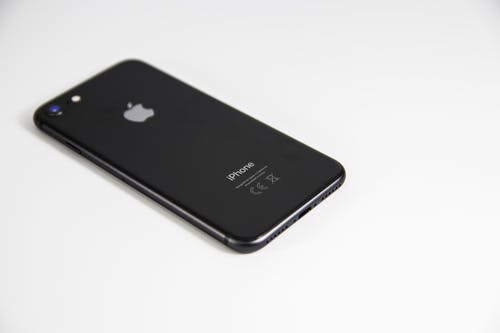
There are a variety of phone apps now available on the market which provide opportunities for better data collection to measure prevalence.
WASHINGTON, D.C. — The latest report from the National Distracted Driving Coalition identifies crucial gaps in distracted driving data measuring the prevalence of the problem in North America.
This new report, entitled Distracted Driving Prevalence Data: Sources, Challenges & Technological Solutions, suggests the magnitude of the distracted driving problem continues to be underestimated. This gap is concerning because it can delay the development and implementation of legislation and other policies to address it, even as the surge in risky driving brought on by the pandemic continues. The report also highlights potential opportunities for emerging technological solutions to collect more robust and complete data.
“According to the National Highway Traffic Safety Administration (NHTSA) there were 3,142 people killed and 324,652 others injured on U.S. roadways because of distracted driving in 2020,” says Robyn Robertson, President & CEO of Traffic Injury Research Foundation (TIRF) and co-author of the new report. “However, crash data sources are fraught with limitations because it can be challenging for officers to determine whether distraction was a factor without physical evidence or drivers admitting fault. This means crash data numbers are likely underestimated, which can make distraction appear to be a lower priority to policymakers when compared to speeding or impaired driving.”
Available data sources: strengths and limitations
The report includes a high-level overview of available data sources and their strengths and limitations. These include sources such as collision data, conviction data, naturalistic driving studies, observational studies, telephone and online surveys, in-person surveys, and cellphone user data, all of which have gaps. For example, telephone and online surveys are limited by how well the surveyed driver remembers using a communications device and how willing they are to admit using such a device while driving. There’s also evidence to suggest many respondents simply don’t associate some tasks with distraction.
“Whether we’re talking about government data, observational studies, or survey data, these studies help illustrate the distracted driving problem,” says Jennifer Smith, CEO and founder of Stopdistractions.org. “But due to limitations in these data sources, it’s fair to say it’s an even bigger problem than we’re able to measure, and that may negatively affect policy and resource decisions to support prevention strategies.”
Technological opportunities

There are a variety of phone apps now available on the market which provide opportunities for better data collection to measure prevalence. Able to detect phone handling while also capturing information about location and speed, such apps can offer critical new insight. For example, Cambridge Mobile Telematics’ DriveWell platform measured a 34.7% increase in average nighttime distracted driving between February and April 2020, as the COVID-19 pandemic was beginning to unfold.
Other technological solutions include naturalistic driving studies using instrumented vehicles and smart cameras positioned on the roadside. These systems can accurately detect distracted driving while maintaining privacy through encrypted connections.
“New technologies offer new windows into the problem,” says Robertson. “Cameras that can accurately detect distraction in moving vehicles at all hours of the day will improve the accuracy, breadth, and timeliness of data collection. They can also aid in research toward developing effective countermeasures.”
To access Distracted Driving Prevalence Data: Sources, Challenges & Technological Solutions, visit https://bit.ly/NDDC-Prevalence-Data.


Join the conversation!